


Most programmes are designed around sessions. They should be designed around outcomes. After years of running masterclasses, accelerator programmes, angel trainings and strategy work across Europe, the Middle East and Africa, this is the single biggest design shift we now push for with every client. Here is why, and how to do it with one page: the Program Outcome Canvas.
“So, what actually changed?”
Here is a moment almost every programme owner knows. The masterclass went brilliantly. The room was buzzing. The feedback forms came back glowing: 9/10, “best programme we’ve attended”, “we need more of this”. The wrap-up deck went out, the invoice got paid, and everyone moved on.
Six months later, someone asks a simple question. A new director, a board member, a funder: “So, what actually changed?”
And nobody has a good answer.
We recently went back through several years of programmes we have delivered. When we got to the column labelled Outcomes, the honest entries read like this:
- “Very strong feedback from participants.”
- “Participants are more engaged.”
- “One new fund in creation, we think.”
- “Not yet mapped or measured.”
Good programmes. Real impact, in many cases. But almost none of it was designed, baselined or tracked. The outcomes were left to chance, anecdote and the occasional LinkedIn post.
The fix is not hard. It just has to happen much earlier than most of us think.
Sessions are not outcomes. Neither is feedback.
A programme can be measured on five levels. Most of us stop at level three.
| Level | What it tells you | Typical example |
|---|---|---|
| 1. Activity | We showed up | 2 webinars + a 3-day masterclass delivered |
| 2. Output | Things were produced | 40 participants, 12 pitch decks reworked, 1 strategy document |
| 3. Feedback | People liked it | NPS 90, “extremely valuable” |
| 4. Outcome | Behaviour or results changed | 8 first-time angels made a deal within 12 months |
| 5. Impact | The system changed | The regional angel network doubled capital deployed in 3 years |
Levels 1 to 3 are what programmes usually buy, and what providers usually report. They are easy to count, they arrive on day zero, and they make everyone feel good.
Levels 4 and 5 are what the programme is actually for. Nobody funds a masterclass to get a high NPS. Ministries, development banks, innovation agencies, clusters and corporate boards fund programmes to get more capital deployed, more companies scaling, stronger organisations, new funds closed.
Feedback is a leading indicator. It is not an outcome. A participant saying “now I want to start investing” is a promise. Their first signed term sheet nine months later is the outcome.
Why outcomes keep getting skipped
Nobody is against outcomes. So why are they so rarely designed in? In our experience, five things get in the way:
- Outcomes arrive after the contract ends. The programme runs for 4–12 weeks. The outcomes that matter show up in 6–48 months.
- Nobody owns the tracking. The funder assumes the host organisation tracks it. The host assumes the provider does. The provider assumes nobody is asking.
- There is no baseline. “More active angels” means nothing without “from how many?”
- The Terms of Reference describe deliverables. “Deliver a 3-day masterclass for 30 participants” is a session spec, not an outcome spec.
- Outcomes come up too late. The “what did this achieve?” conversation usually starts after delivery. By then it is a reporting exercise, not a design choice.
That last one is the root cause. Outcomes are a design decision, not a reporting task.
Five shifts to lock in outcomes
- Embed outcome thinking at design stage. Before agenda, speakers and dates: what must be different in 90 days, 12 months and 4 years because this programme happened?
- Co-create targets and an as-is baseline with the key stakeholders. The funder, the host organisation and ideally a few participants. Agree where things stand today, in numbers.
- Write the outcomes into the Terms of Reference. Every TOR or proposal gets a section called “Target Outcomes & How We Track Them”.
- Give tracking a named owner. One person with a title and a calendar reminder. Not “the team”.
- Track regularly, for up to four years. Quarterly check-ins, short surveys, a simple tracker. Light-touch, but relentless.
None of this requires a big M&E budget. It requires a decision, early, that outcomes matter more than the agenda.
The Program Outcome Canvas
To make the shifts practical, we built the Program Outcome Canvas. One page. One row per outcome. Read left to right, each row tells the story from “where we are today” to “what changed four years later”.
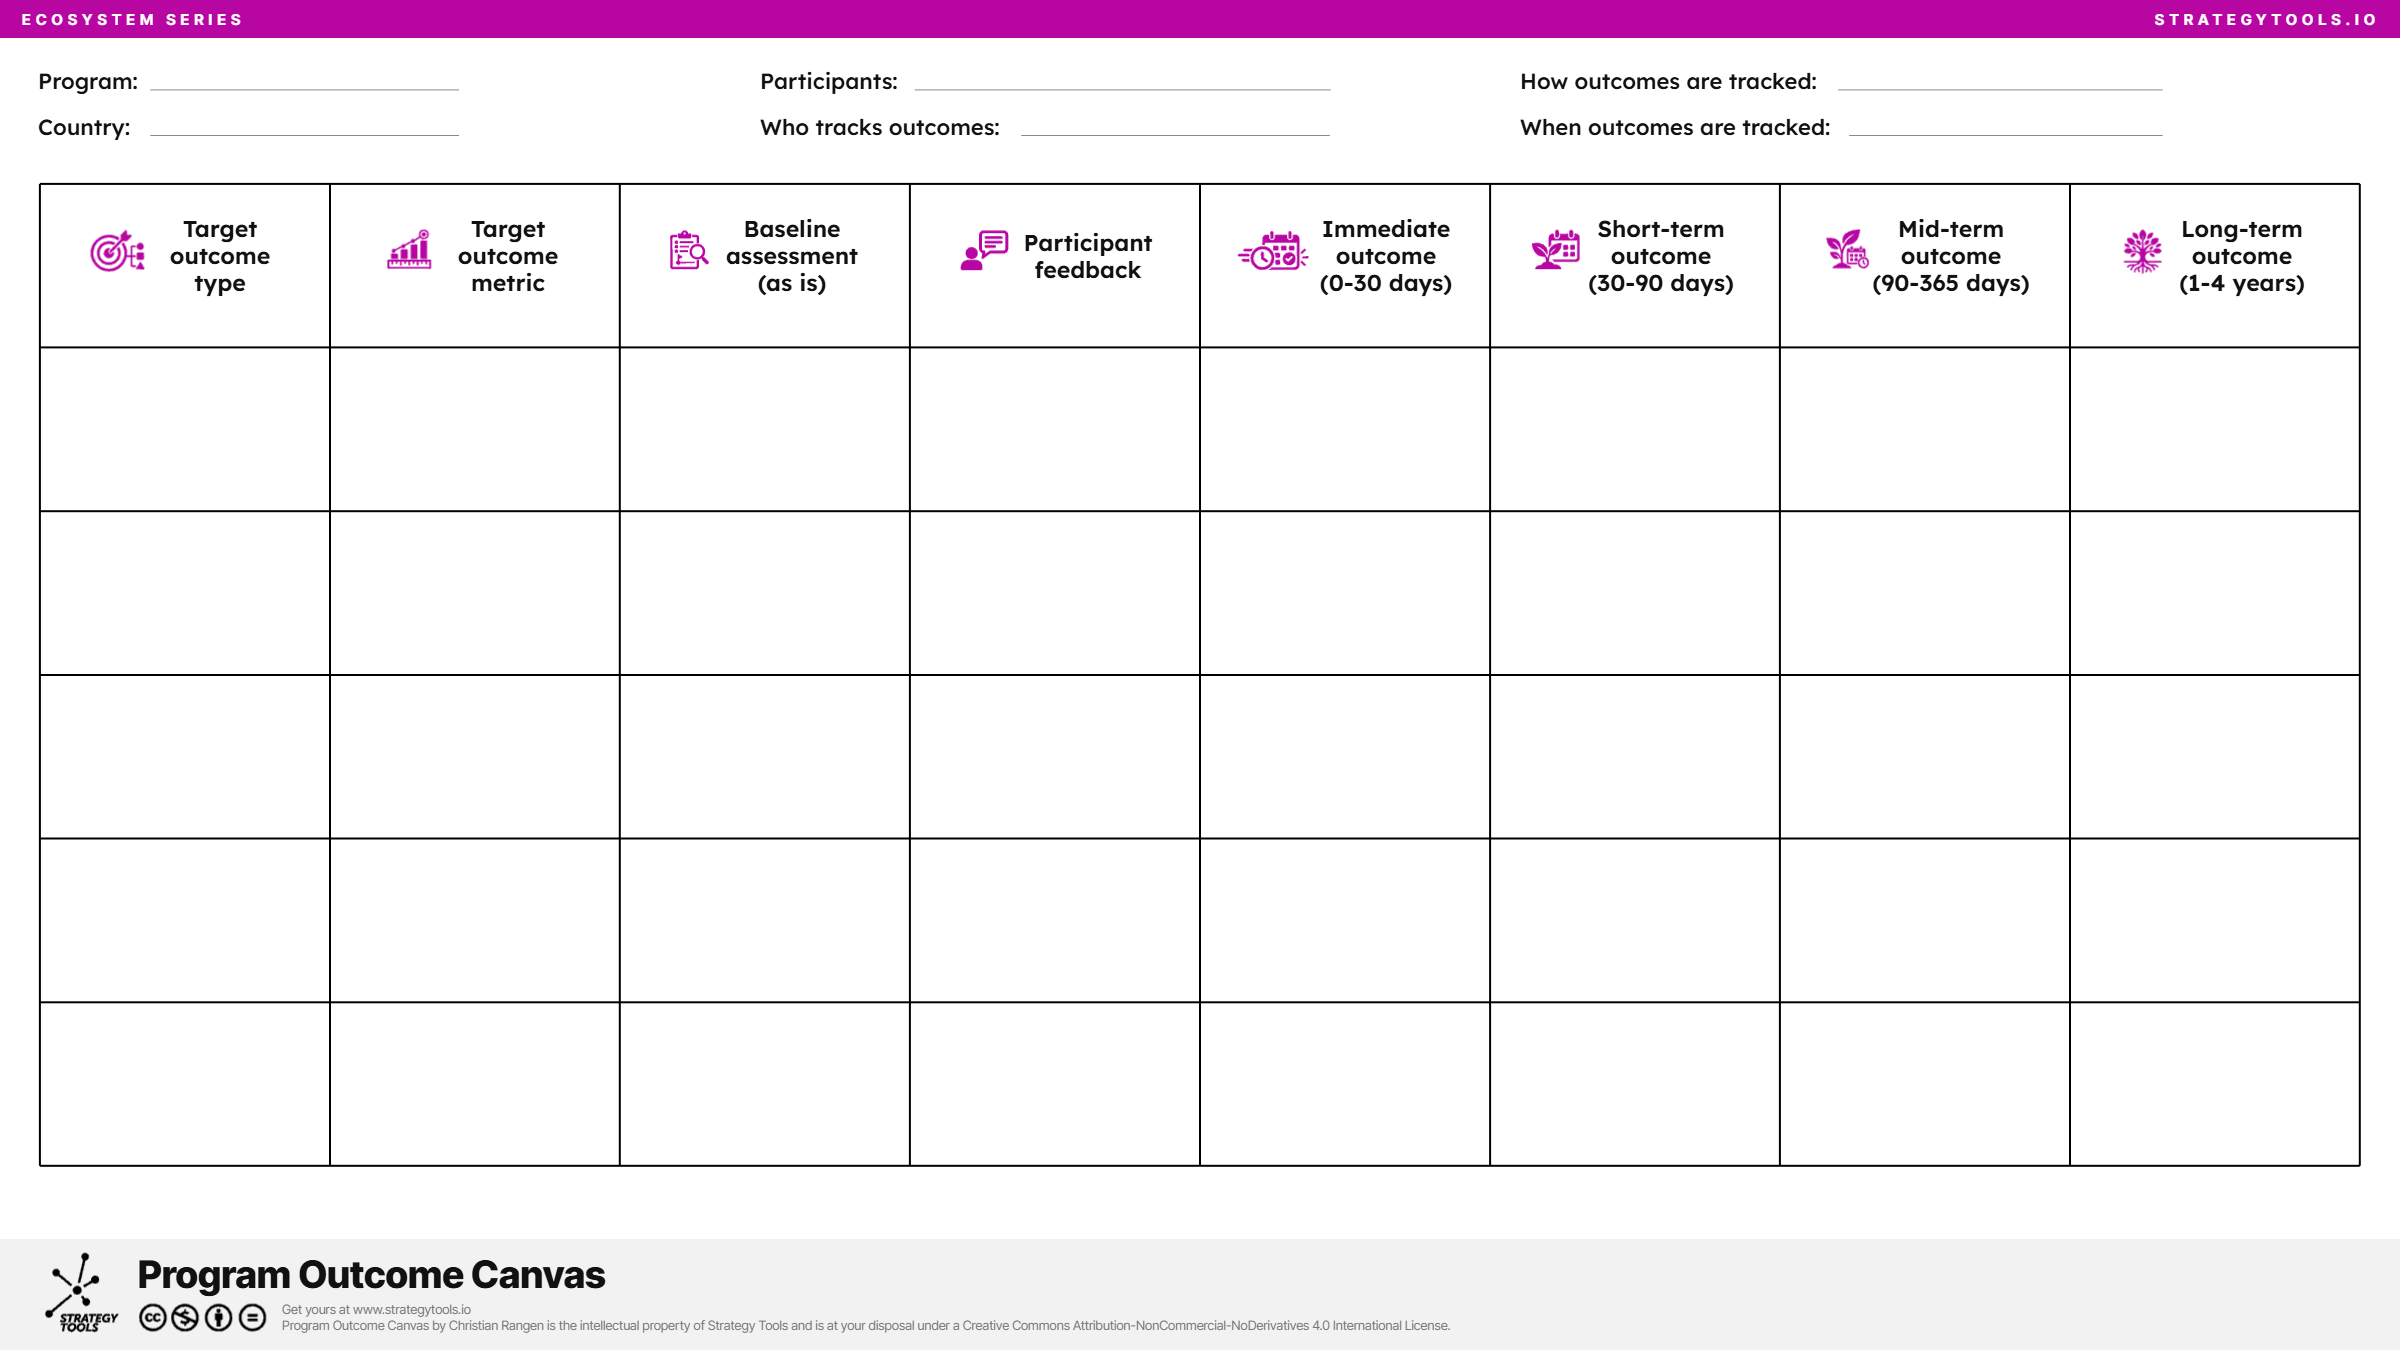
The header forces the governance questions that usually get skipped: the programme and country, exactly who participates, who tracks outcomes, how they are tracked, and when.
The eight columns carry each outcome over time: the target outcome type, the metric, the baseline (as is), the expected participant feedback, and then what we expect to see at 0–30 days, 30–90 days, 90–365 days and 1–4 years.
Two design choices matter. First, participant feedback is its own column, sitting between the baseline and the results. It is the bridge: the quote (“now I want to start investing”) that should later turn into a number (“10 first-time deals”). Second, the time columns stretch to four years. That forces everyone to confront, on day one, that the most valuable outcomes arrive long after the last session.
Four examples, filled in
The best way to understand the canvas is to see it in use. The four examples below are illustrative composites, based on the kinds of programmes we and our partners deliver every year. Names and numbers are made up; the logic is real. Click any canvas to open it full size.
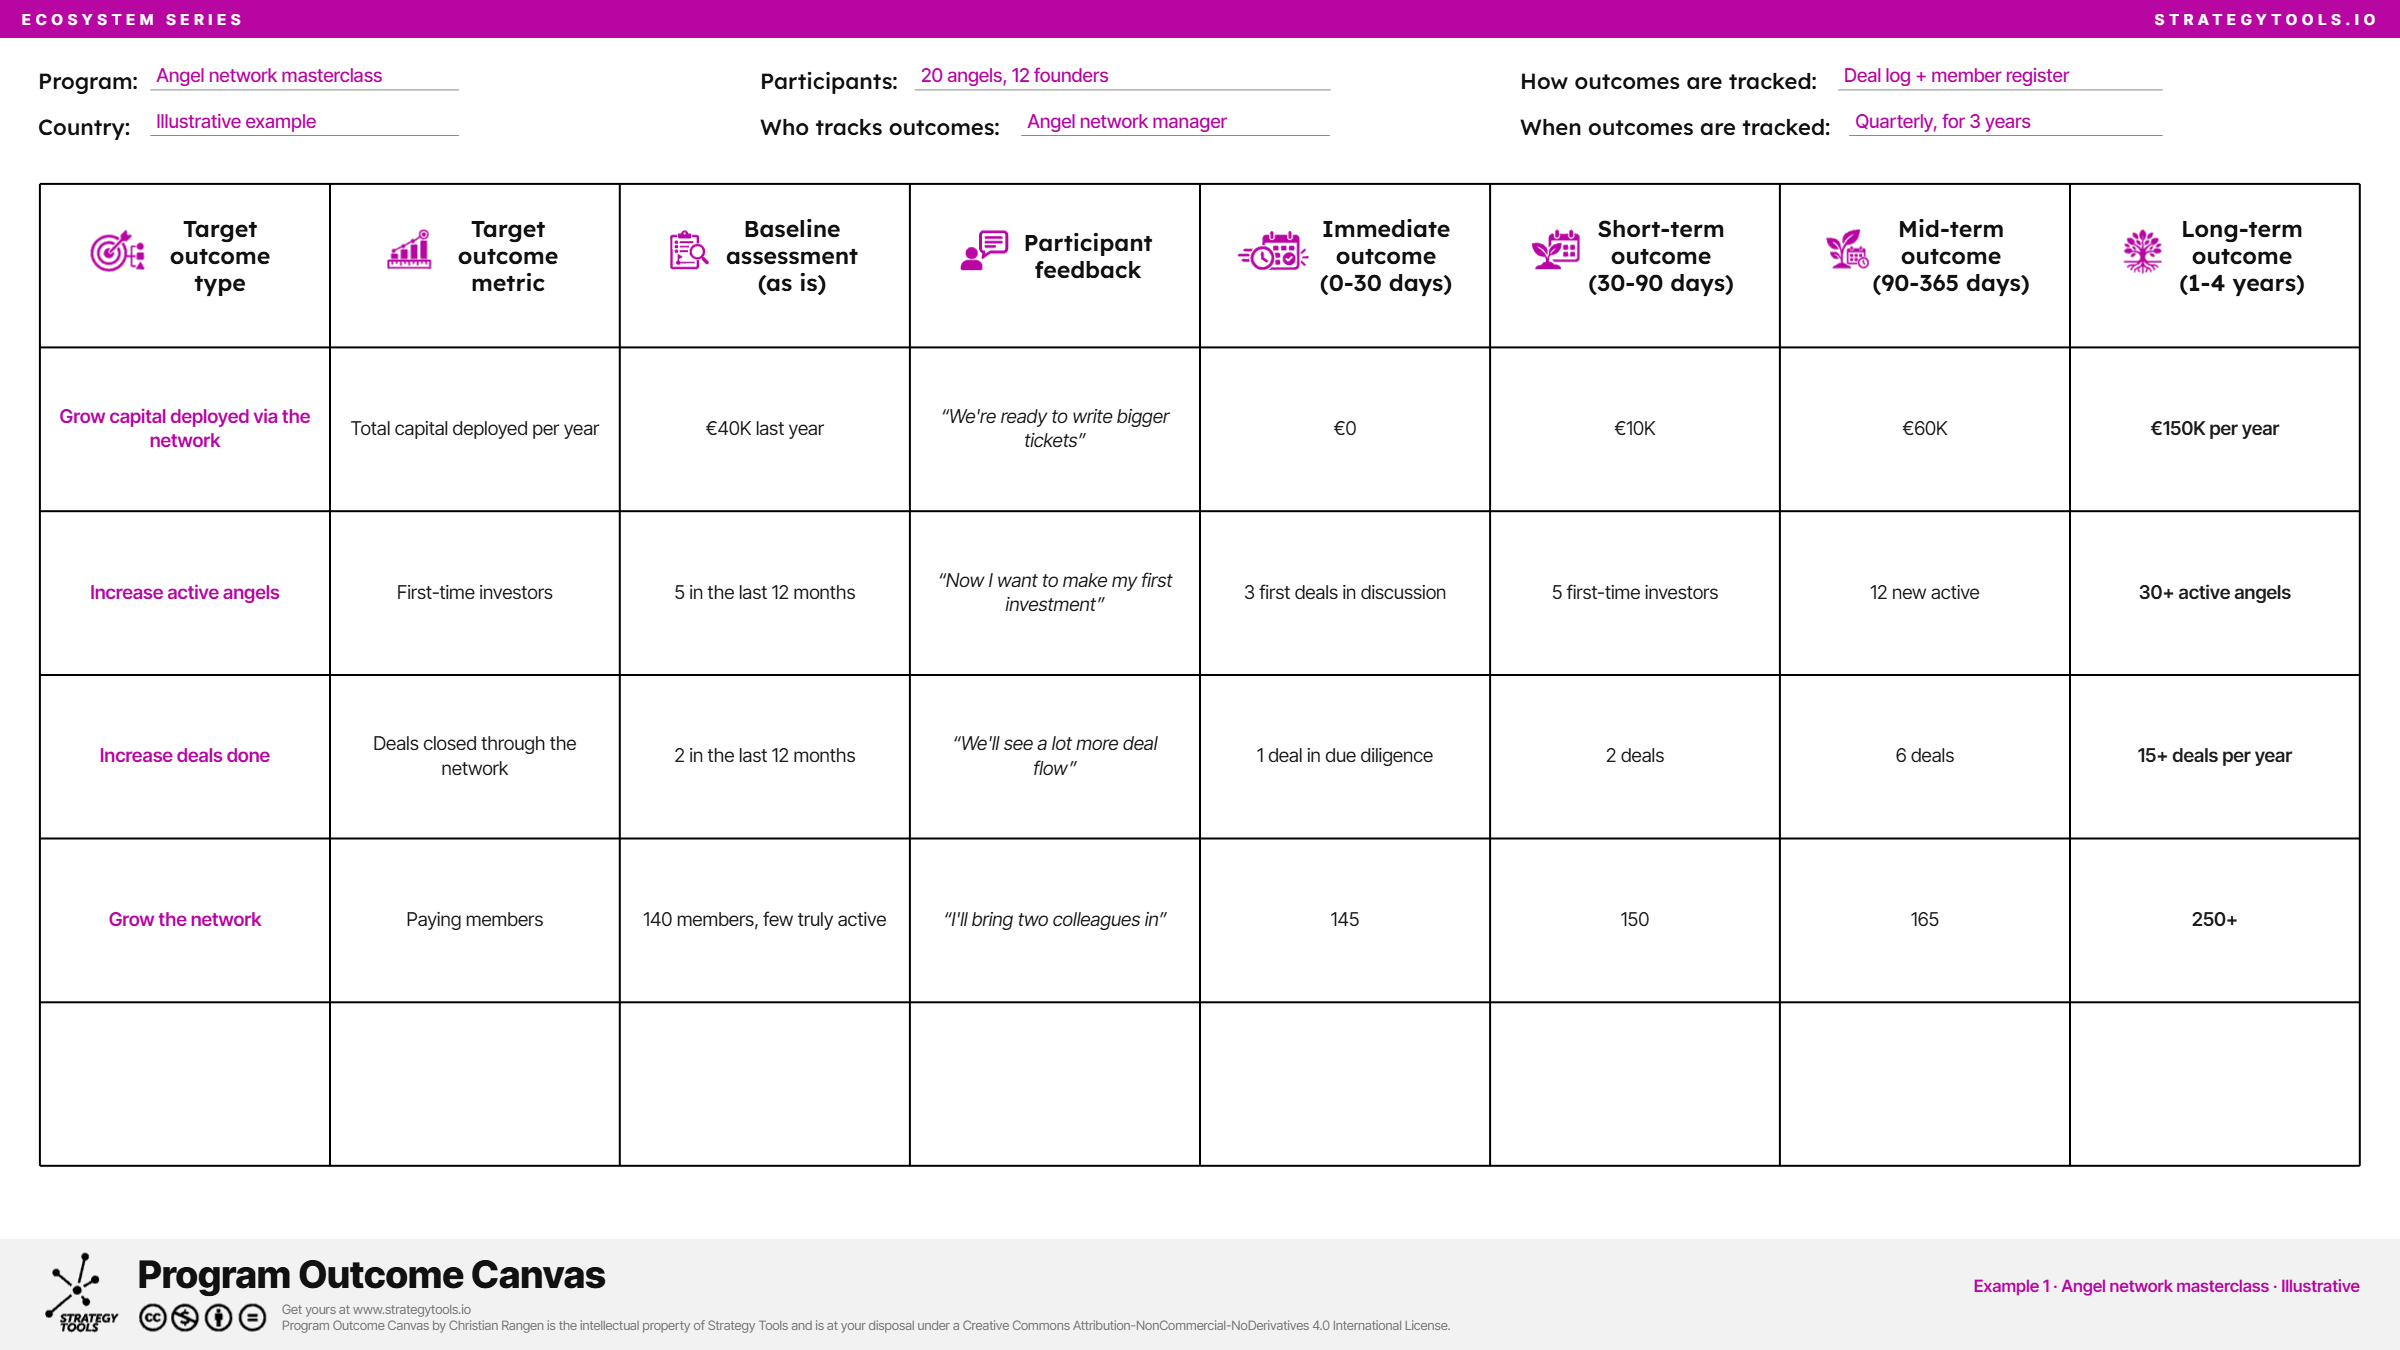
Example 1: Angel network masterclass
Two prep webinars and a two-day masterclass for 20 angels and 12 founders. The angel network manager tracks outcomes quarterly, for three years.
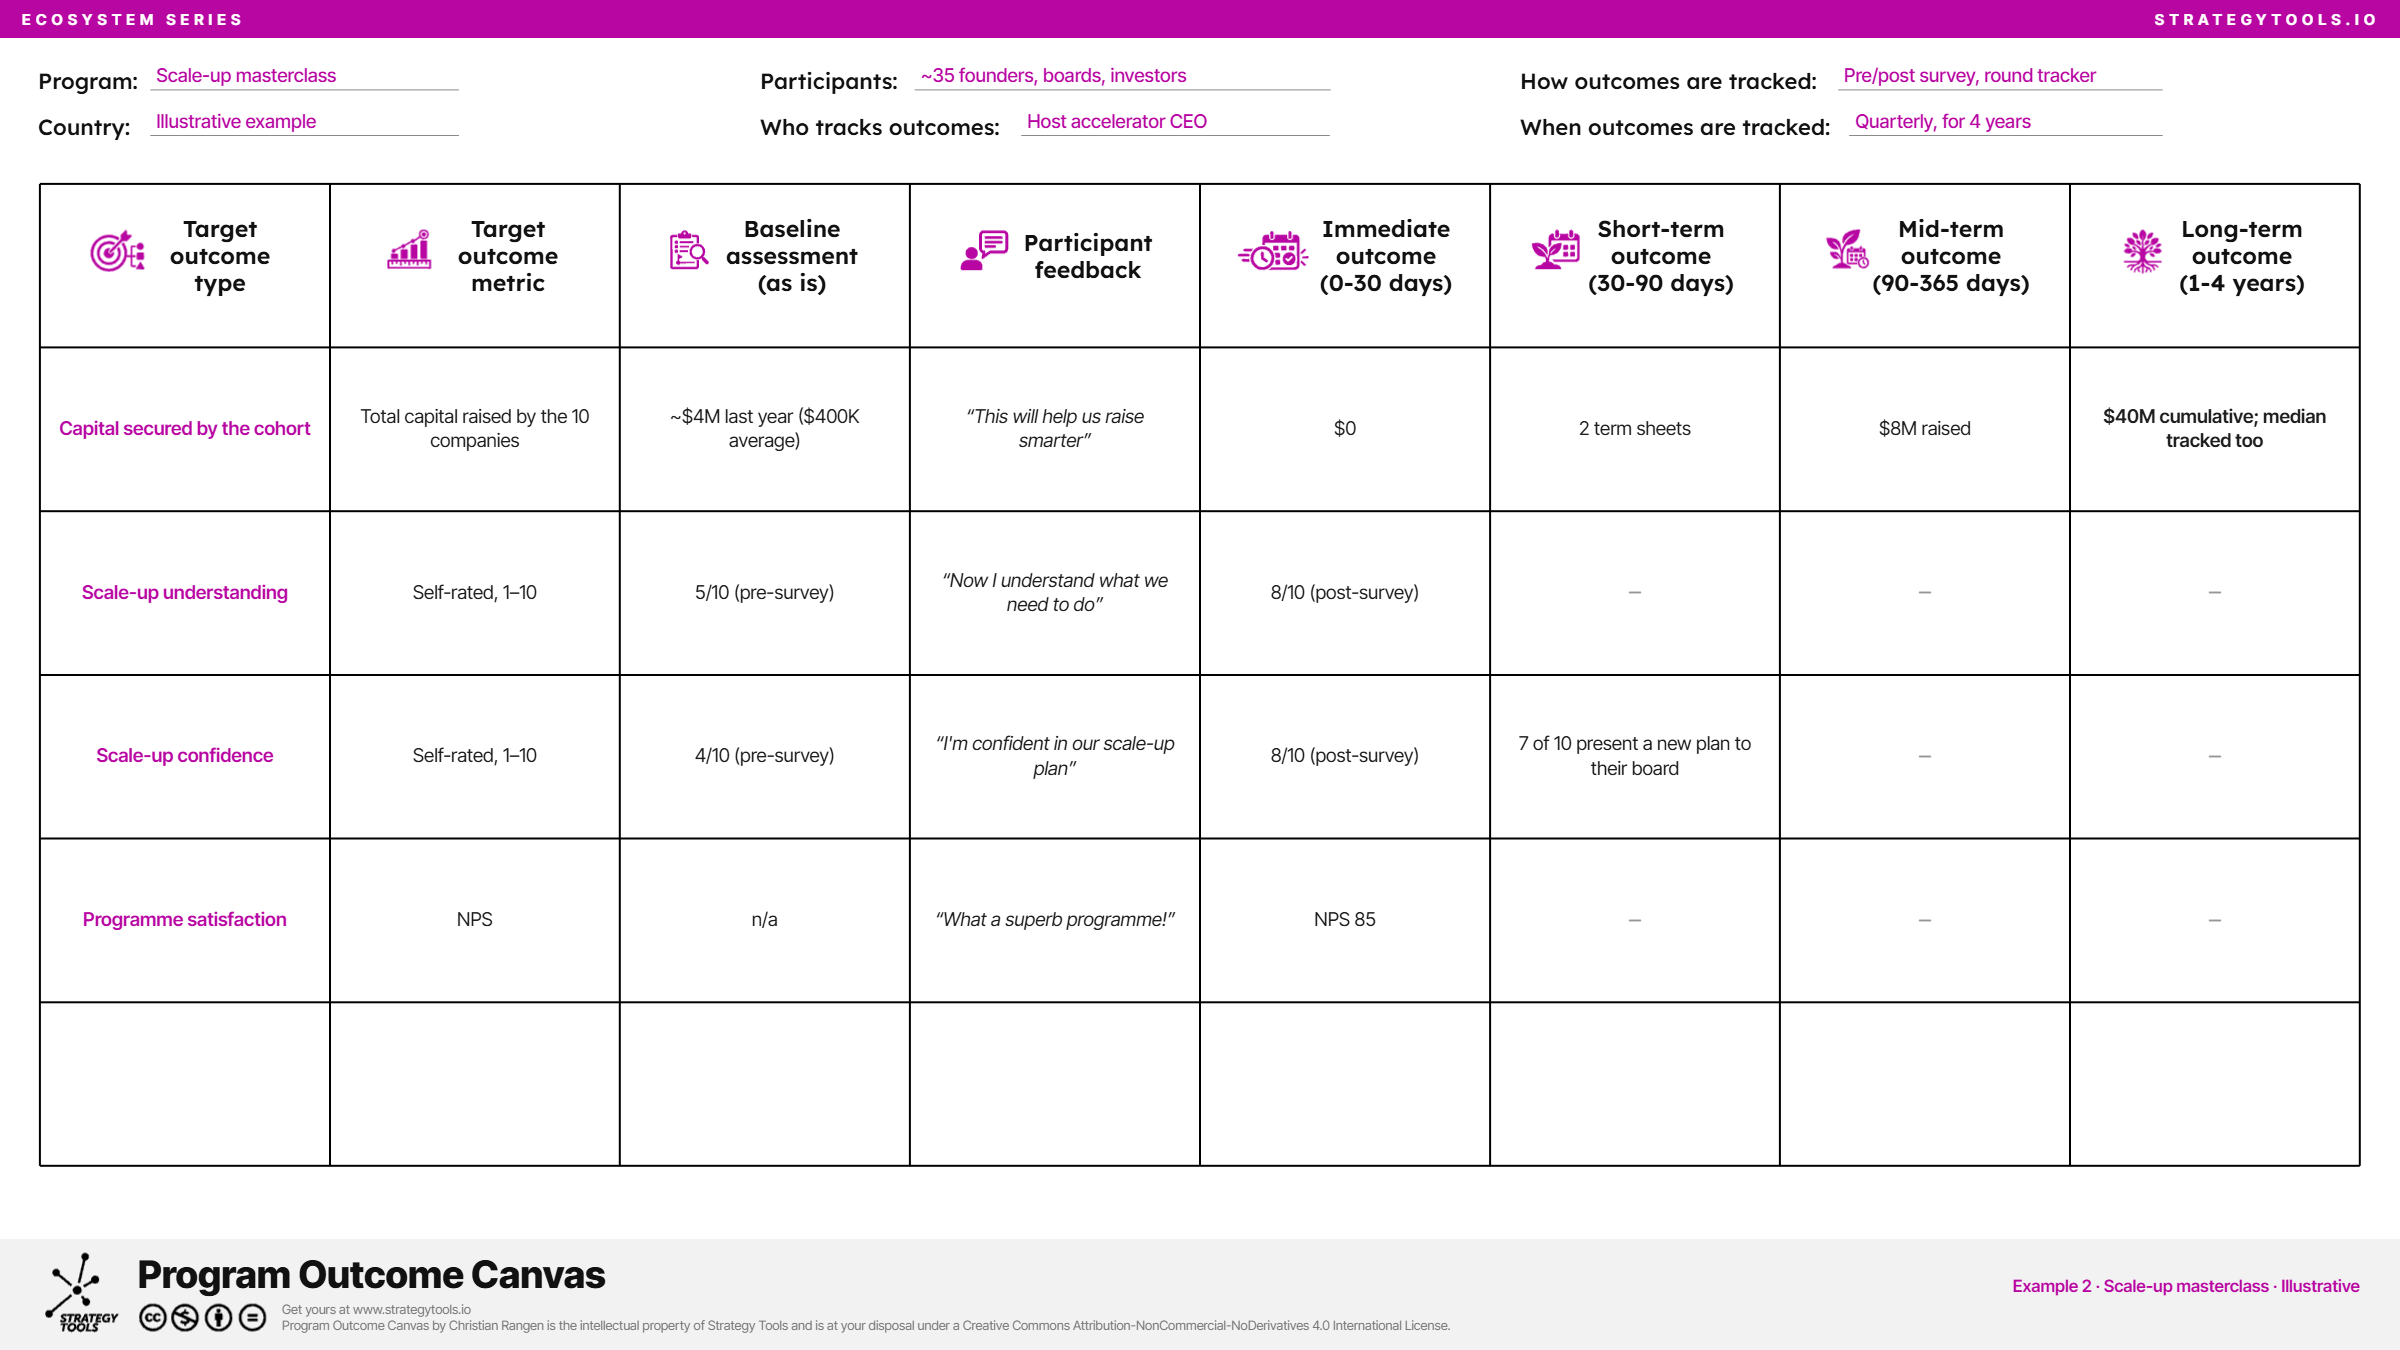
Example 2: Scale-up masterclass for founders and investors
A three-day masterclass, including train-the-trainers, for about 35 founders, board members and investors from 10 scale-ups. The host accelerator’s CEO tracks outcomes quarterly, for four years.
Example 3: Accelerator strategy and funding programme
Ten online working sessions over four months with an accelerator’s management team, across three workstreams: programme content, strategy and funding. The CEO tracks outcomes quarterly, for four years.

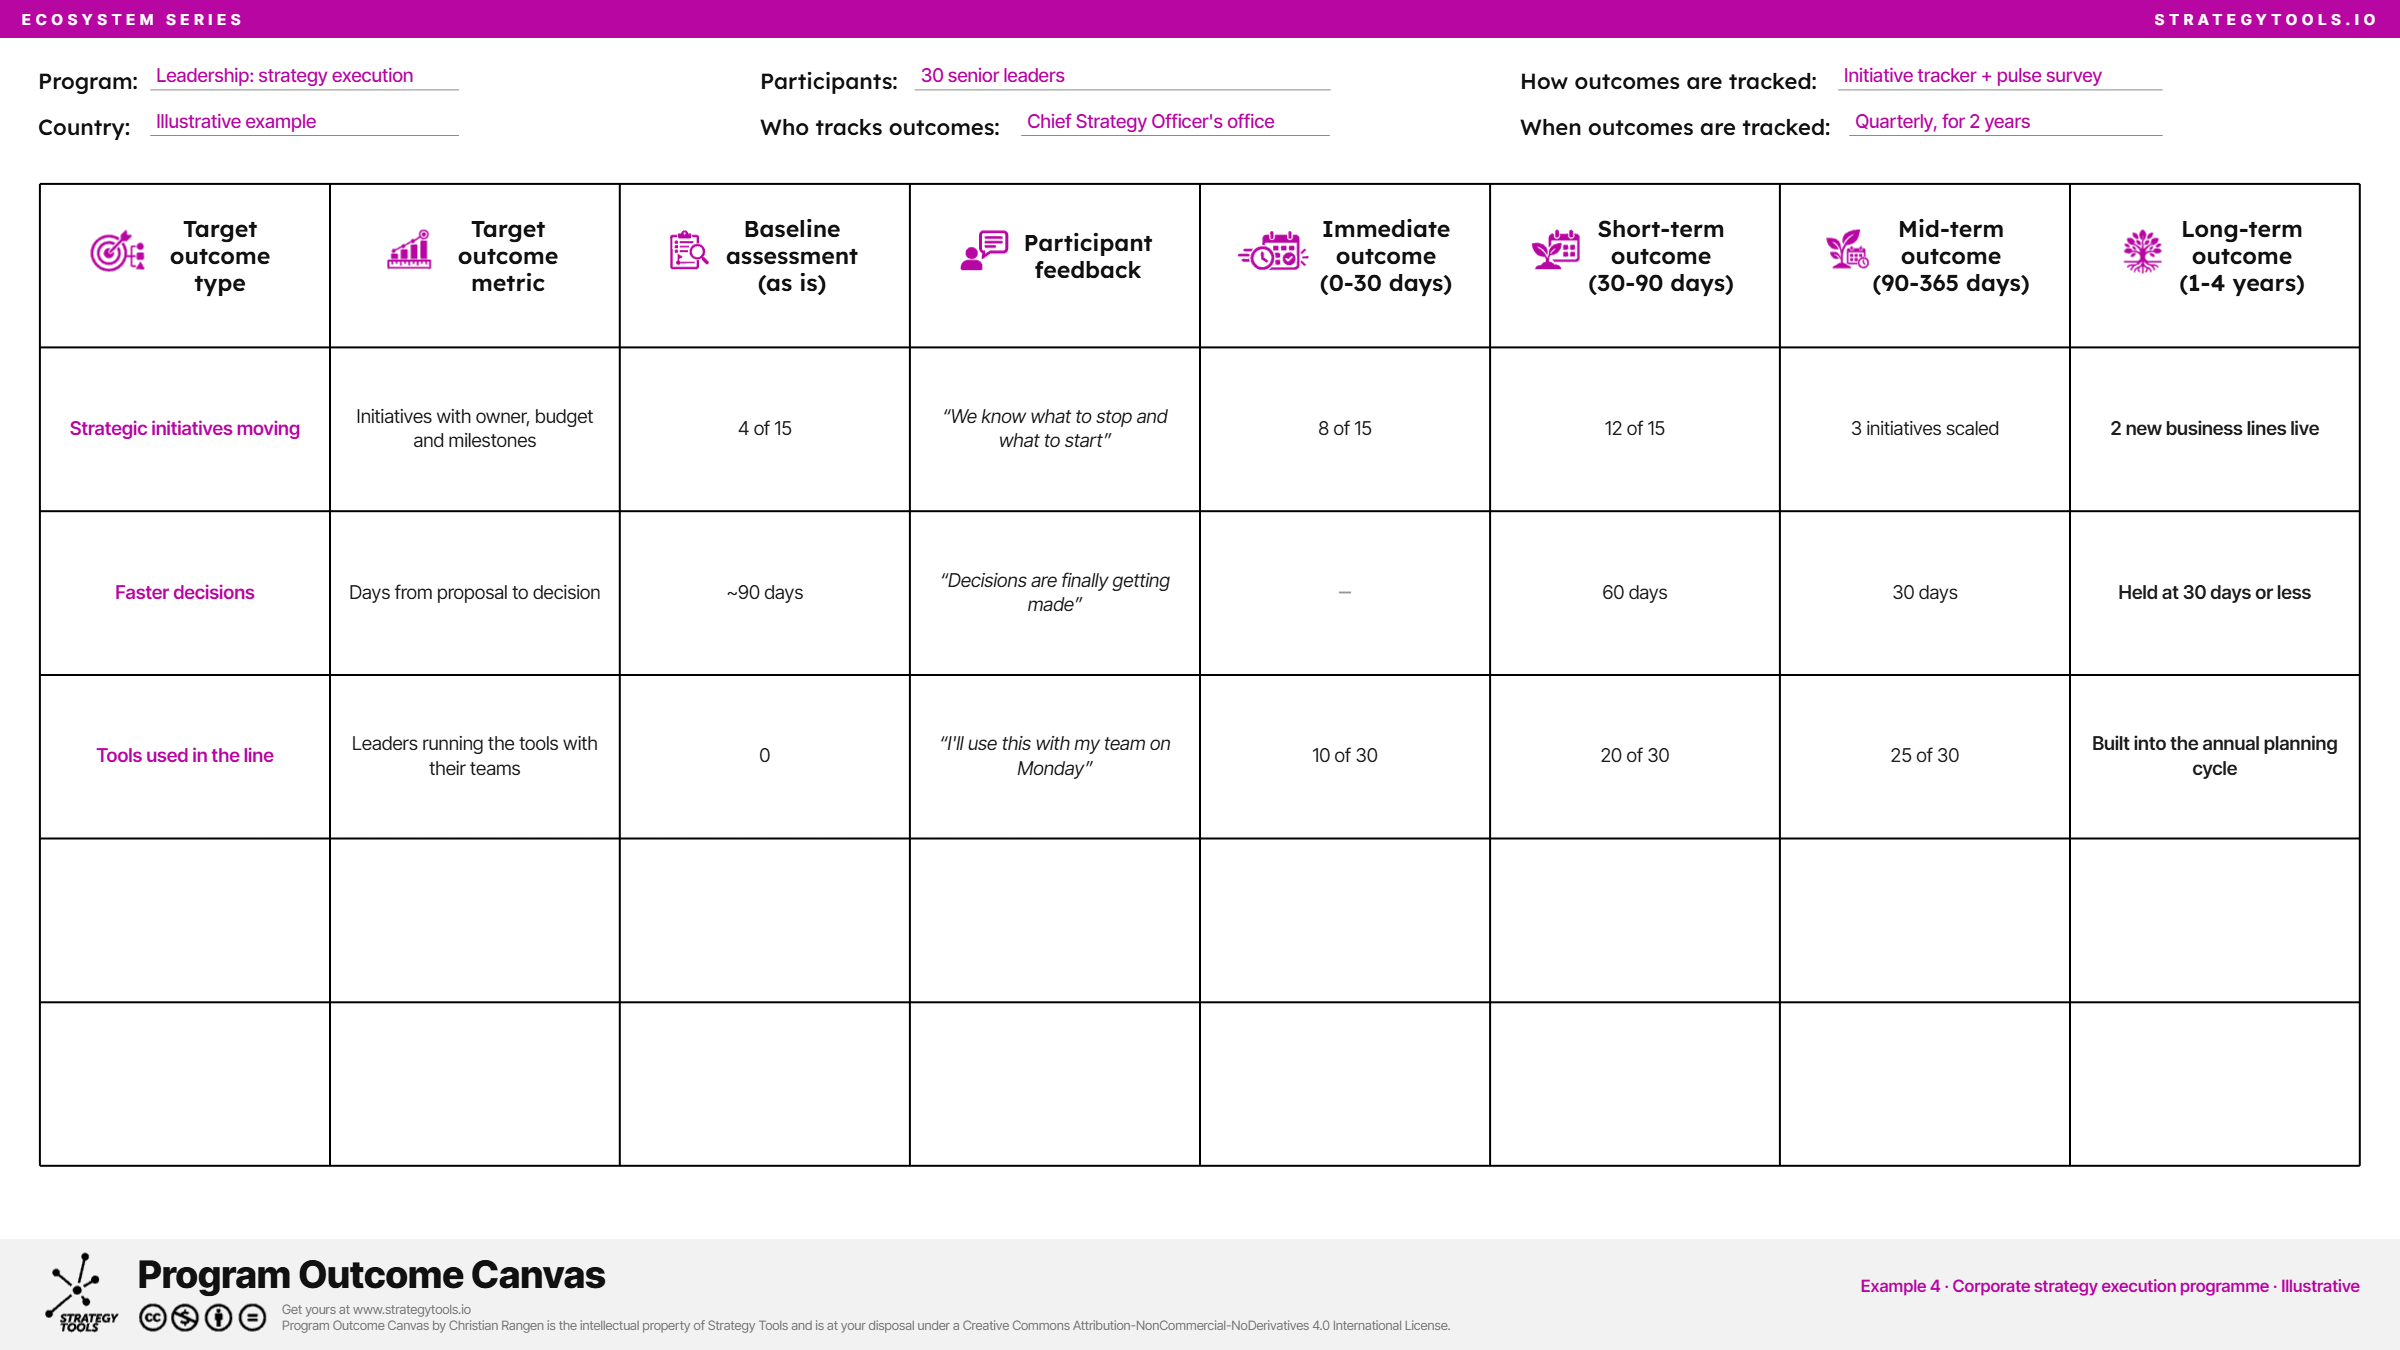
Example 4: Corporate leadership programme on strategy execution
The canvas is not only for ecosystem work. Four modules over six months for 30 senior leaders, with work on live strategic initiatives in between. The Chief Strategy Officer’s office tracks outcomes quarterly, for two years.
What the examples teach
- Different rows close at different times. Understanding, confidence and NPS are complete within 30 days. Capital, deals and new business lines only show up in years 1–4. A report that stops at day 30 only shows the cheap rows.
- The baseline makes the claim credible. “$8M raised” is noise. “$8M raised, up from $4M the year before” is an outcome.
- Every feedback quote should point at a number. “Now I want to start investing” only matters if a later column checks whether they did.
- Yes/no outcomes are fine. For organisation building, “strategy board-approved” is a perfectly good metric.
- Watch for outliers. One company landing a huge round can make a whole cohort look brilliant, or hide that most of it stalled. Track the median as well as the total.
Six common mistakes
- Filling the canvas after delivery. Then it is a report, not a design tool.
- Too many rows. Three to five outcomes is plenty.
- Only feedback rows. If every row is NPS or self-rated confidence, you have measured the session, not the outcome.
- No baseline, or a made-up one. “We don’t know” is a valid baseline, but write it down and fix it.
- “The team” as owner. Without a named person, tracking stops after the first quarter.
- Promising outcomes the programme can’t influence. Be ambitious, but honest about contribution versus attribution.
How to start with your next programme
- Ask the outcome question before the format question. “Four years from now, what is different because this programme happened?”
- Run a 60–90 minute canvas session with the funder, the host organisation and the provider. Fill in three to five rows and agree who tracks, how and when.
- Put the canvas into the TOR or proposal as “Target Outcomes & How We Track Them”.
- Design the sessions backwards from the rows. If a session serves no outcome, cut it.
- Collect the baseline and feedback during delivery. A pre-survey on day one, a post-survey on the last day.
- Agree a quarterly rhythm with the named owner, and revisit the canvas together at 12 months.
Lock in outcomes before you lock in the agenda
We have all seen great sessions that went nowhere, and modest sessions that quietly changed a lot but could never prove it. Both are the same failure: the outcomes were never designed in.
So take the next programme you are about to design or fund. Before you finalise the agenda, fill in the Program Outcome Canvas. Three to five rows. A real baseline. A named owner. A tracking rhythm that runs past the last session.
A year from now, you will have a far better answer to the question that matters: “So, what actually changed?”
The Program Outcome Canvas is part of the Strategy Tools Ecosystem Series and is free to use under a Creative Commons Attribution-NonCommercial-NoDerivatives 4.0 licence. Want help designing an outcome-focused programme? Get in touch.